
This blog is part of a series looking deeper at Envoy Proxy and Istio.io and how it enables a more elegant way to connect and manage microservices. Follow me @christianposta to stay up with these blog post releases.
- What is Envoy Proxy, how does it work?
- How to implement some of the basic patterns with Envoy Proxy?
- How Istio Mesh fits into this picture
- How Istio Mesh works, and how it enables higher-order functionality across clusters with Envoy
- How Istio Mesh auth works
Here’s the idea for the next couple of parts (will update the links as they’re published):
- Circuit breakers (Part I)
- Retries / Timeouts (Part II)
- Distributed Tracing (Part III)
- Metrics collection with Prometheus (Part IV)
- Service Discovery (Part V)
- The next parts will cover more of the client-side functionality (Request Shadowing, TLS, etc), just not sure which parts will be which yet :)
Part III - Distributed Tracing with Envoy Proxy
The first blog post introduced you to Envoy Proxy’s implementation of circuit-breaking functionality. In the second part, took a closer look at how to enable additional resilience features like timeouts and retries. In this third part, we’ll see how to enable distributed tracing in our service mesh. These demos are intentionally simple so that I can illustrate the patterns and usage individually. Please download the source code for this demo and follow along!
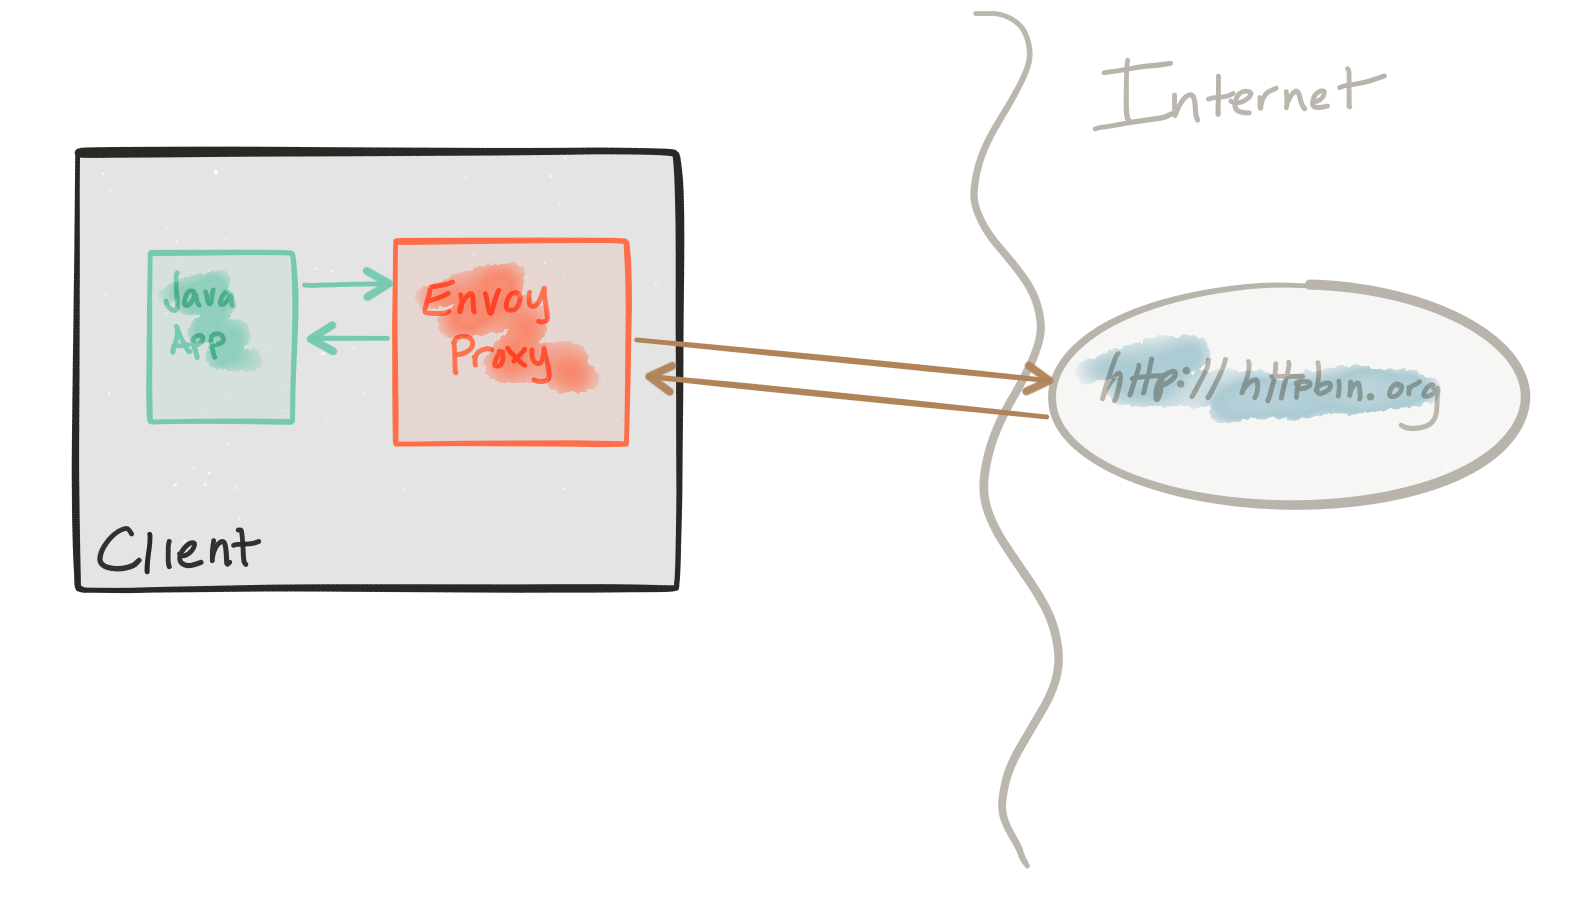
This demo is comprised of a client and a service. The client is a Java http application that simulates making http calls to the “upstream” service (note, we’re using Envoys terminology here, and throught this repo). The client is packaged in a Docker image named docker.io/ceposta/http-envoy-client:latest. Alongside the http-client Java application is an instance of Envoy Proxy. In this deployment model, Envoy is deployed as a sidecar alongside the service (the http client in this case). When the http-client makes outbound calls (to the “upstream” service), all of the calls go through the Envoy Proxy sidecar. Envoy then adds tracing headers that is sent along during service calls and are sent to Zipkin (or your tracing provider… Envoy supports Zipkin and Lightstep at the moment)
The “upstream” service for these examples is httpbin.org. httpbin.org allows us to easily simulate HTTP service behavior. It’s awesome, so check it out if you’ve not seen it.
The tracing demo have its own envoy.json configuration file. I definitely recommend taking a look at the reference documentation for each section of the configuration file to help understand the full configuration. The good folks at datawire.io also put together a nice intro to Envoy and its configuration which you should check out too.
Running the tracing demo
For the tracing demo, we’ll be configuring our Envoy with the following salient config (see the full config for the rest of the context:
    "tracing": {
      "operation_name": "egress"
    },

    ...

      "tracing": {
        "http": {
          "driver": {
            "type": "zipkin",
            "config": {
              "collector_cluster": "zipkin",
              "collector_endpoint": "/api/v1/spans"
            }
          }
        }
      },

      ...

       {
          "name": "zipkin",
          "connect_timeout_ms": 1000,
          "type": "strict_dns",
          "lb_type": "round_robin",
          "hosts": [
            {
              "url": "tcp://zipkin:9411"
            }
          ]
        }
Here we’re configuring our tracing driver and tracing cluster. In this case, to run this demo, we’ll need to start up a Zipkin server:
First stop any existing demos:
./docker-stop.shThen bootstrap our zipkin server:
./tracing/docker-run-zipkin.shThis will expose zipkin onto ports 9411. If you’re using minikube or something similar to run these demos, you can directly export the minikube port to your host like this:
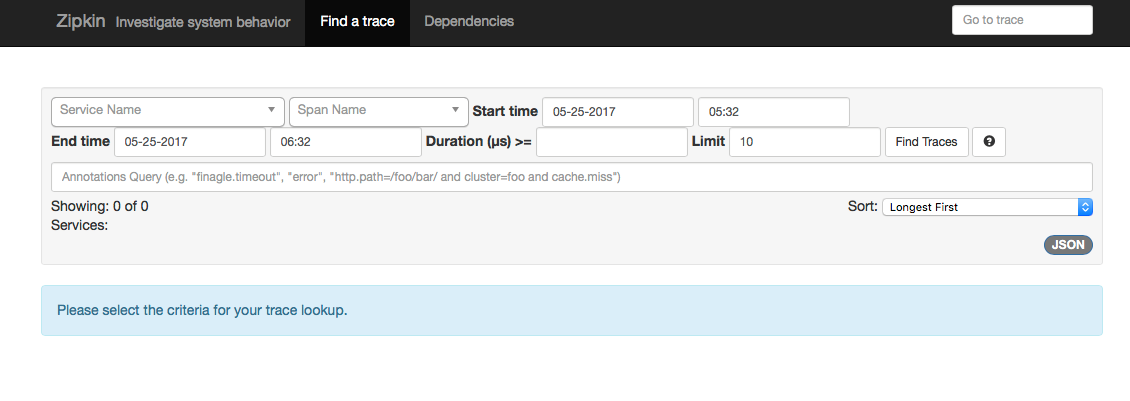
./port-forward-minikube.sh 9411Check out that command to port it to whatever your docker host may look like. Once you’ve gotten Zipkin up and running, navigate to the service (ie, on minikube, after doing the port forwarding, it would just be http://localhost:9411). You should see Zipkin:
Now that we’ve got our zipkin server up, let’s start up our tracing demo:
./docker-run.sh -d tracingLet’s send some traffic through our client:
./curl.sh -vvvv localhost:15001/getWe should get a response that looks like this:
< HTTP/1.1 200 OK
* Server envoy is not blacklisted
< server: envoy
< date: Thu, 25 May 2017 06:31:02 GMT
< content-type: application/json
< access-control-allow-origin: *
< access-control-allow-credentials: true
< x-powered-by: Flask
< x-processed-time: 0.000982999801636
< content-length: 402
< via: 1.1 vegur
< x-envoy-upstream-service-time: 142
<
{
  "args": {},
  "headers": {
    "Accept": "*/*",
    "Connection": "close",
    "Host": "httpbin.org",
    "User-Agent": "curl/7.35.0",
    "X-B3-Sampled": "1",
    "X-B3-Spanid": "0000b825f82b418d",
    "X-B3-Traceid": "0000b825f82b418d",
    "X-Ot-Span-Context": "0000b825f82b418d;0000b825f82b418d;0000000000000000;cs"
  },
  "origin": "68.3.84.124",
  "url": "http://httpbin.org/get"
}
Now if we go to our Zipkin server, we should see a single span/trace for this call (note, you may have to adjust the start/stop times in the zipkin filter:
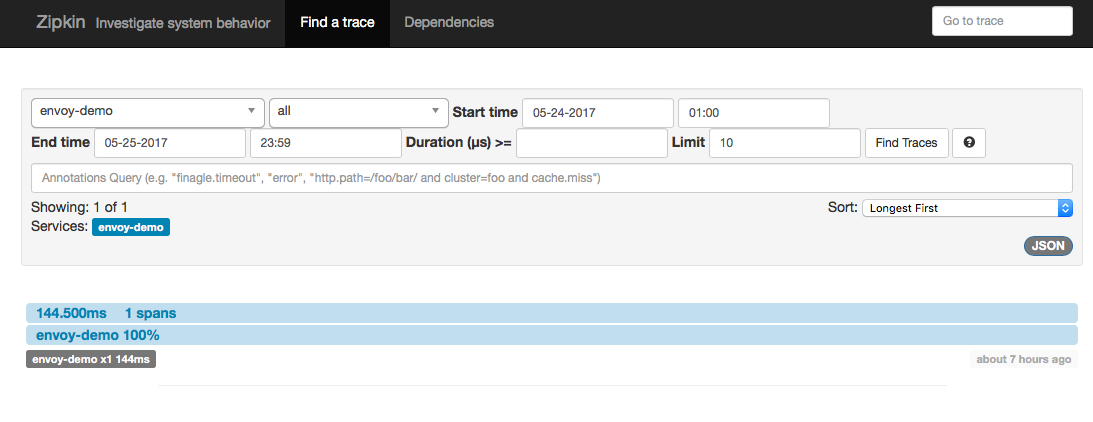
Here we have a single trace that has a single span (which is what we expect since our demo client which has Envoy is talking directly to an external service that does not have Envoy… if the upstream service also had Envoy with zipkin enabled, we’d see the full set of spans between services)
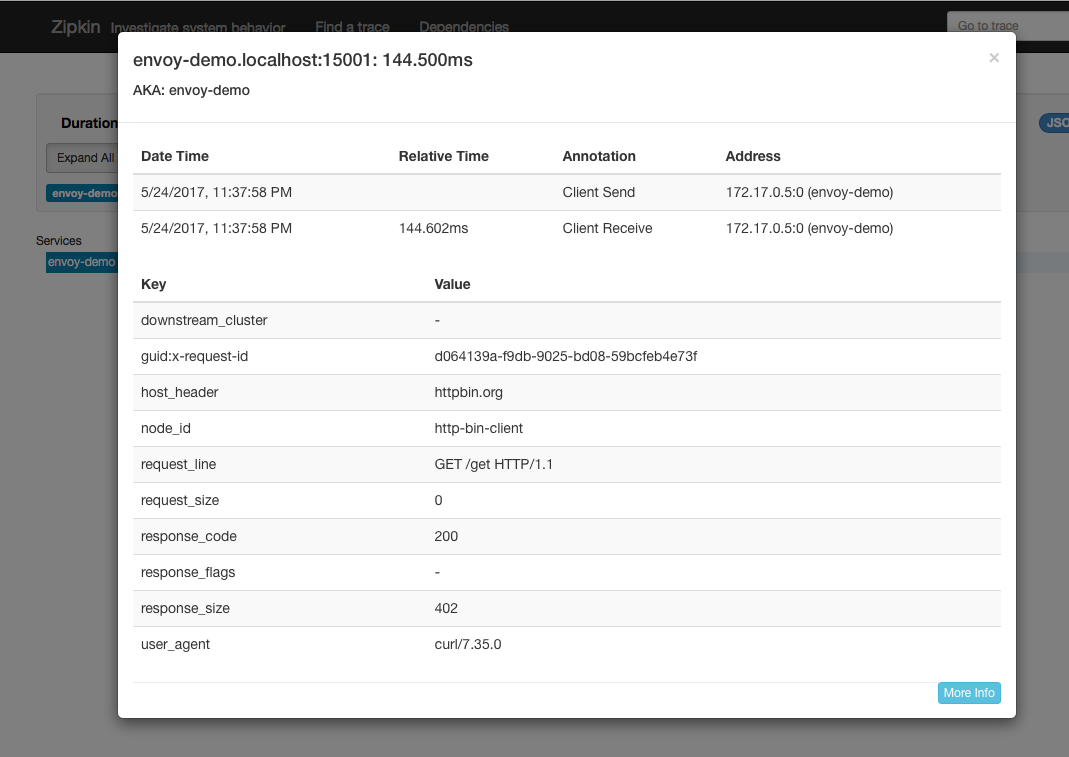
If we click into the span to see more detail, we’d see something like this:
Note
Do note that every service in your services architecture should have Envoy deployed alongside and participating in distributed tracing. The beauty of this approach is that tracing happens out of band from the application. However, for tracing context to be propagated properly, it’s the application developer’s responsibility to properly propagate the correct headers so that different spans are properly correlated. Check the zipkin for more details, but at a minimum you want to propagate these headers (as seen from above):
x-request-idx-b3-traceidx-b3-spanidx-b3-parentspanidx-b3-sampledx-b3-flagsx-ot-span-context
Series
Please stay tuned! Part IV should be landing soon!